
Why this guide exists
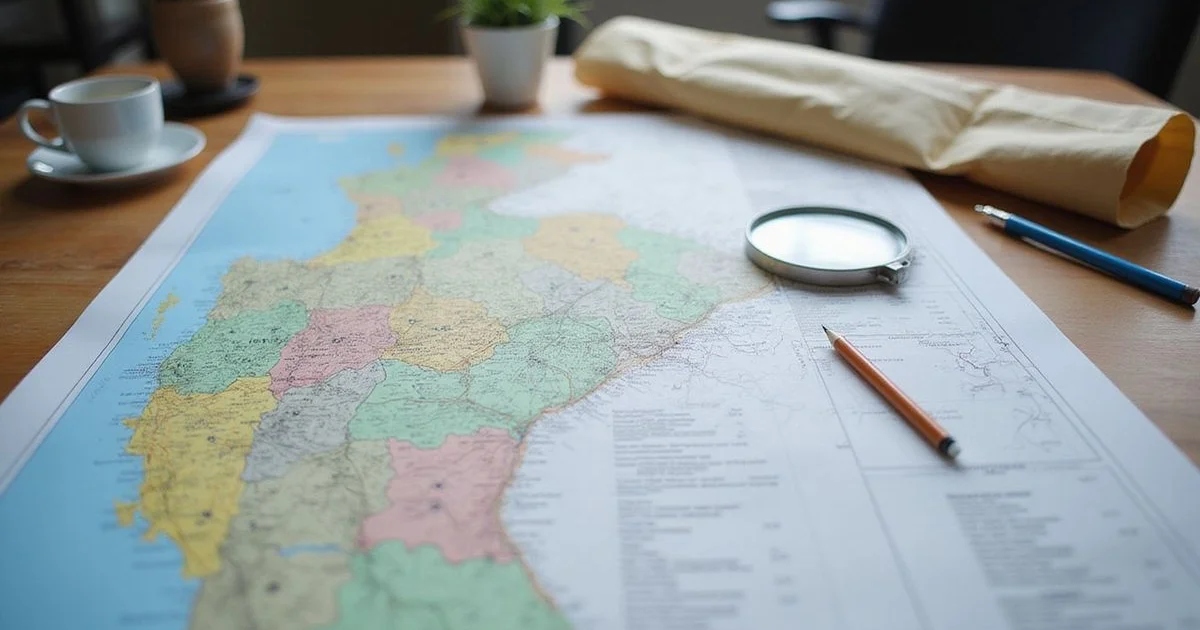
Soil and geology maps are genuinely useful, publicly available, and routinely misread. Homeowners find a map, identify the unit their address sits in, and reach a conclusion about their house. Marketing content does the same thing more deliberately, converting mapped units into neighbourhood risk ratings.
Both are over-interpretation. This guide covers what these maps are, what they can support, and where the limits sit.
The two kinds of map
Soil survey maps describe surface soils. In the United States the primary source is NRCS soil survey data, which divides the landscape into mapped units and describes each series: texture, profile, drainage characteristics, shrink-swell behavior, and typical uses. Series names you may encounter around Fort Worth include Houston Black and Heiden, alongside others such as Purves, Sanger, Denton, San Saba, Slidell, Bolar, Aledo, Silawa, and Konsil depending on the area.
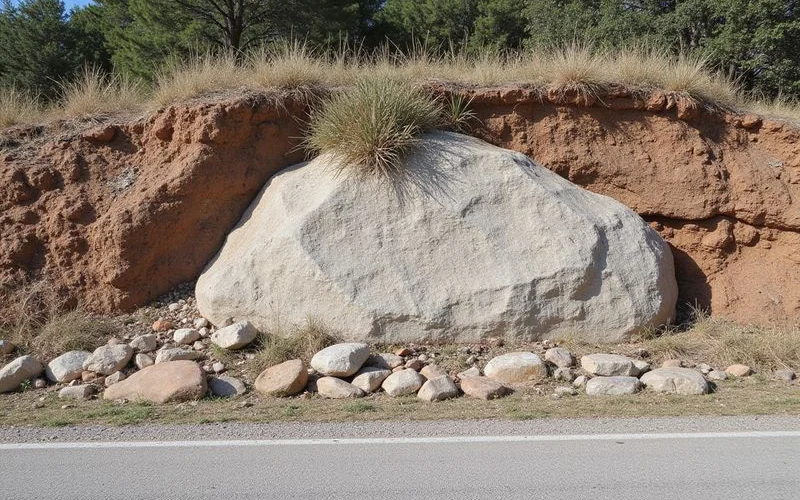
Geological maps describe bedrock formations beneath the soil. These come from state and federal geological survey publications and use a completely different vocabulary — formations and groups rather than series.
They answer different questions, they are produced at different scales, and conflating them is the most common error in this area.
Scale is the thing everyone ignores
Soil survey mapping is produced at a scale suited to land management across large areas. At that scale, a residential lot is a very small object. The line separating two mapped units on a survey is a generalisation, not a property boundary, and a single lot can straddle one.
Survey data also carries a date. Mapping produced decades ago describes the landscape as it was surveyed, which in a rapidly developed area may bear limited resemblance to the ground under a house built since.
And critically, none of it accounts for what construction did to the site:
- Fill imported during development
- Cut-and-fill grading to create a level building pad
- Utility trenching and backfill around the perimeter
- Landscaping soil added over decades
- Drainage alterations
By the time a house is standing, the ground under it has been modified in ways no regional survey can capture.
The principle
A soil map describes a landscape. An evaluation describes a building. They are not substitutes for each other, and no amount of zooming in converts one into the other.
What these maps are good for
They are good for regional understanding. Knowing that expansive clay is widespread across the area explains why foundation movement is a common topic here and why drainage and moisture management get so much attention.
They are good for context when reading a report. If an evaluator references shrink-swell behavior, knowing what that means in mapped terms makes the report more legible.
They are good for general risk awareness across a region — the sort of reasoning that informs building practice and code rather than individual property decisions.
They are also genuinely interesting, which is a legitimate reason to look at them.
What they cannot support
| Claim | Why the map does not support it |
|---|---|
| “This property is high risk” | Mapping has no property-level resolution |
| “Every home in this suburb sits on X” | Units are generalised; lots can straddle boundaries |
| “Bedrock is 12 feet down here” | Geological maps indicate formation, not depth at a point |
| “Shallow rock means no movement” | Surface clay above rock still shrinks and swells |
| “Your neighbourhood has a foundation problem” | Conflates regional context with building condition |
We do not publish property condition scores derived from soil maps, and our editorial standards say so explicitly. It is a way of borrowing the authority of a scientific source to make a marketing claim it does not support.
What actually answers property-level questions
A foundation evaluation measures the building: relative elevations across the house, documented observations, and site conditions including grade, drainage, irrigation, and tree proximity. That produces evidence about the structure.
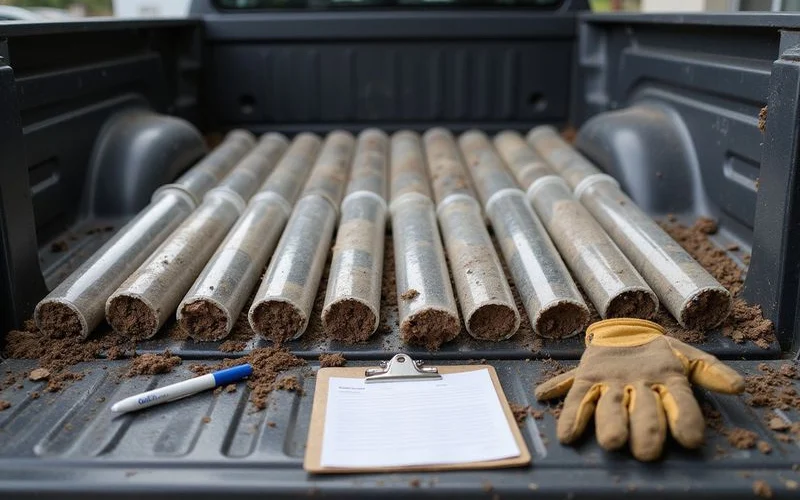
Geotechnical investigation — actual borings on the site — establishes subsurface conditions at specific points. That is the tool for genuinely site-specific subsurface questions: depth to competent material, soil properties at depth, groundwater. It is commissioned where the stakes warrant it, typically for unusual situations or engineered design rather than routine residential repair.
Installation records from pier work are, after the fact, a form of site-specific subsurface data. The depth at which each support reached refusal tells you something concrete about that property that no map could have.
For the broader regional picture and what expansive clay actually does, the companion guide on Fort Worth soils and foundations covers the mechanism. For your specific house, it is a foundation evaluation.